Once Prometheus starts scraping Fluent Bit metrics, you can view them in OpenShift's Observe-Metrics tab.
Access OpenShift Console
Navigate to the OpenShift Console and go to the "Observe" section.
Explore Fluent Bit Metrics
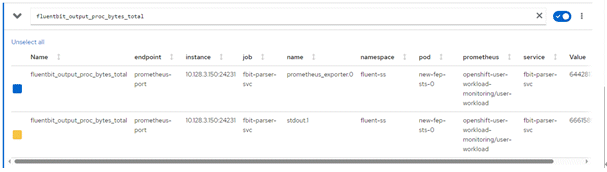
Use Prometheus queries to explore Fluent Bit metrics, for example:
fluentbit_output_proc_bytes_total