Monitoring and alerts system leverages standard GAP stack ( Grafana, Alert manager, Prometheus) deployed on OCP and Kubernetes. GAP stack must be there before FEP operator & FEPCluster can be deployed.
Prometheus is a condensed way to store time-series metrics. Grafana provides a flexible and visually pleasing interface to view graphs of FEP metrics stored in Prometheus.
Together they let store large amounts of metrics that user can slice and break down to see how the FEP database is behaving. They also have a strong community around them to help deal with any usage and setup issues.
The Prometheus acts as storage and a polling consumer for the time-series data of FEP container. Grafana queries Prometheus to displaying informative and very pretty graphs.
If Prometheus rules are defined, it also evaluates rules periodically to fire alerts to Alert manager if conditions are met. Further Alert manager can be integrated with external systems like email, slack, SMS or back-office to take action on alerts raised.
Metrics from FEP Cluster(s) is collected by Prometheus through optional components deployed using FEP Exporter with default set of metrices and corresponding Prometheus rules to raise alerts. User may extend or overwrite metrics by defining their custom metrics queries and define their custom Prometheus rules for alerting.
Block diagram of monitoring FEP server is as follows.
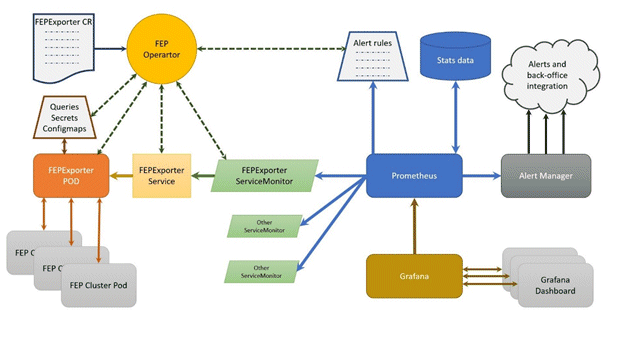
FEPExporter CR is managed by FEP Operator
When FEPExporter CR is created, FEP operator creates following kubernetes objects:
ConfigMap that contains default and custom queries to collect metrics from database cluster from each node
Secret containing JDBC URL for all FEPCluster nodes to connect and request metrics. This string contains authentication details as well to make JDBC connection.
Prometheus rules corresponding to default alert rules
ServiceMonitor for Prometheus to discover FEPExporter service
FEPExporter container using FEPExporter image to scrape metrices from all FEPCluster nodes
Note
Alert Manager integration to back-office to send mail / message / raising ticket is done by user based on their environment
Grafana installation and integration is done by user. Use the Grafana Operator provided by OperatorHub.
Grafana dashboard is created by user based on their requirements and design.
By default FEPExporter scrapes some useful metrics for server.
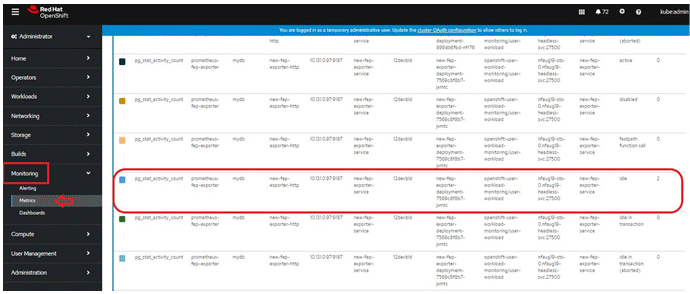
Once FEPExporter is running, user can check the collected metrics under Openshift->Monitoring->Metrics submenu.
Refer an example below.
There are 2 types of default server metrics defined by FEP Exporter.
Type | Details |
|---|---|
Default mandatory | Are collected by FEP Exporter. These are kept enabled by default by FEP Exporter and can not be disabled by end user. |
Default useful | Useful focused metrics for health and performance metrics. Can be disabled by end user. |
Default mandatory metrics
These metrics are either from basic statistics view of the database or FEP Exporter own metrics;
Various metrics under this category are
Metrics name | Details |
|---|---|
pg_stat_bgwriter_* | Maps to view in Statistic Collector |
pg_stat_database_* | Maps to view in Statistic Collector |
pg_stat_database_conflicts_* | Maps to view in Statistic Collector |
pg_stat_archiver_* | Maps to view in Statistic Collector |
pg_stat_activity_* | Maps to view in Statistic Collector |
pg_stat_replication_* | Maps to view in Statistic Collector |
pg_replication_slots_* | Maps to System Catalog pg_replication_slots |
pg_settings_* | Maps to System Catalog pg_settings |
pg_locks_* | Maps to System Catalog pg_locks |
pg_exporter_* | Exposes exporter metrics:
last_scrape_error (Whether the last scrape of metrics from PostgreSQL resulted in an error; 1 for error & 0 for success) |
pg_* | Exposes exporter metrics
|
Default useful metrics
There are certain useful queries which are additionally added to evaluate the health of the Database system.
Metrics name | Details |
|---|---|
pg_capacity_connection_* | Metrics on connections e.g. txns running for 1 hour |
pg_capacity_schema_* | Metrics on disk space of schema |
pg_capacity_tblspace_* | Metrics on disk space of tablespace |
pg_capacity_tblvacuum_* | Metrics on tables without vacuum for days |
pg_capacity_longtx_* | Number of transactions running longer than 5 minutes Review the information and consider SQL tuning and resource enhancements. |
pg_performance_locking_detail_* | Details of processes in blocked state |
pg_performance_locking_* | Number of processes in blocked state |
pg_replication_* | Replication lag behind master in seconds Provides the ability to check for the most current data in a reference replica To solve the problem, it is necessary to consider measures such as increasing network resources and reducing the load |
pg_postmaster_* | Time at which postmaster started |
pg_stat_user_tables_* | Important statistics from pg_stat_user_tables |
pg_statio_user_tables_* | Important statistics from pg_statio_user_tables |
pg_database_* | Database size If the database runs out of space, database restore is required |
pg_stat_statements_* | Statistics of SQL statements executed by server |
pg_capacity_tblbloat_* | Fetched bloat in tables |
pg_tde_encrypted_* | Presence or absence of transparent data encryption in the tablespace and the number of tables and indexes stored |
pg_password_valid_* | Database Role Password Validity Period |
pg_not_set_password_valid_* | Number of database roles with no password expiration |
pg_user_profile_* | Number of database roles in each status for policy-based password operation |
pg_txid_* | Transaction ID usage |
Note
You can tune the intervals and thresholds at which information is gathered by changing the values specified in the information gathering query. For more information, refer to the queries in the appendix of the Reference Guide, and make your own settings.
There are few basic alert rules which are setup by the FEP Operator as below
Alert rule | Alert Level | Condition | Description |
|---|---|---|---|
ContainerHighCPUUsage | Warning | 5 mins | FEP server container/Pod CPU usage is exceeding 80% of the resource limits |
ContainerHighRAMUsage | Warning | 30 mins | FEP server container/Pod memory usage is exceeding 80% of the resource limits |
PVCLowDiskSpace | Warning | 5 mins | A FEP PVC (volume) has less that 10% disk available |
ContainerDisappeared | Warning | 60 seconds | FEP server container/Pod has disappeared since last 60 seconds |
PostgresqlDown | Error | - | FEP server apparently went down or not accessible |
PostgresqlTooManyConnections | Warning | - | FEP server container/Pod connection usage is beyond 90% of its available capacity |
PostgresqlRolePasswordCloseExpierd | Warning | - | A Postgresql role exists with a password expiration of less than 7 days |
PostgresqlRolePasswordExpired | Warning | - | A Postgresql role exists with an expired password |
PasswordIsGraceTimeByUserProfile | Warning | - | There is a Postgresql role that is in the grace period due to policy-based password operation |
PasswordExpiredByUserProfile | Warning | - | There is a Postgresql role whose password has expired due to policy-based password operation |
PasswordLockedByUserProfile | Warning | - | There is a Postgresql role that is locked by policy-based password operation |
PostgresqlTooManyTxidUsage | Warning | 24 hours | The amount of transaction ID usage has exceeded the value of the autovacuum_freeze_max_age parameter in postgresql.conf for more than 24 consecutive hours. |
You can configure any alert by adding alert rules to other monitoring items.
Alerts are based on statistics/metrics. Incorrect platform statistics can cause false alarms. For example, when using NFS storage, the system may raise false alarms for PVCLowDiskSpace when the storage driver is not showing the correct metrics for PV byte usage.
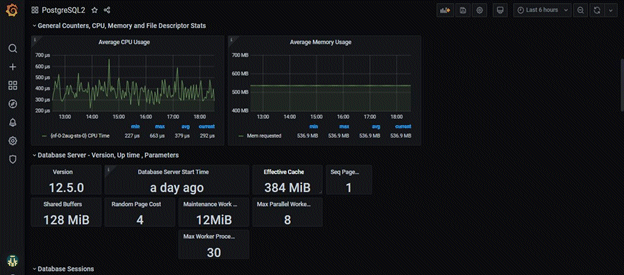
User can build their custom dashboard using default and custom metrics.
An example Grafana dashboard screenshot is shown below
The metrics collected by CloudWatch are listed below.
Metrics name | Description |
|---|---|
pg_stat_bgwriter_* | Maps displayed in statistics collection |
pg_stat_database_* | Maps displayed in statistics collection |
pg_stat_database_conflicts_* | Maps displayed in statistics collection |
pg_stat_archiver_* | Maps displayed in statistics collection |
pg_stat_activity_* | Maps displayed in statistics collection |
pg_stat_replication_* | Maps displayed in statistics collection |
pg_replication_slots_* | Mapping to the pg_replication_slots system catalog |
pg_locks_* | Mapping to the pg_locks system catalog |
pg_capacity_connection_* | Connection metrics (e.g. txns running for 1 hour) |
pg_capacity_schema_* | Schema disk space metrics |
pg_capacity_tblspace_* | Tablespace disk space metrics |
pg_capacity_tblvacuum_* | Metrics for tables that haven't been vacuumed in days |
pg_capacity_longtx_* | Number of transactions running for more than 5 minutes |
pg_capacity_datfrozenxid_* | Transaction ID Usage Trend (Used for scheduling aggressive freeze for tuples (VACUUM FREEZE)) |
pg_performance_locking_detail_* | Blocked process details |
pg_performance_locking_* | Number of blocked processes |
pg_stat_user_tables_* | Vital statistics from pg_stat_user_tables |
pg_statio_user_tables_* | Vital statistics from pg_statio_user_tables |
pg_stat_statements_* | Statistics for SQL statements executed by the server |
pg_capacity_tblbloat_* | Table fetch bloat |