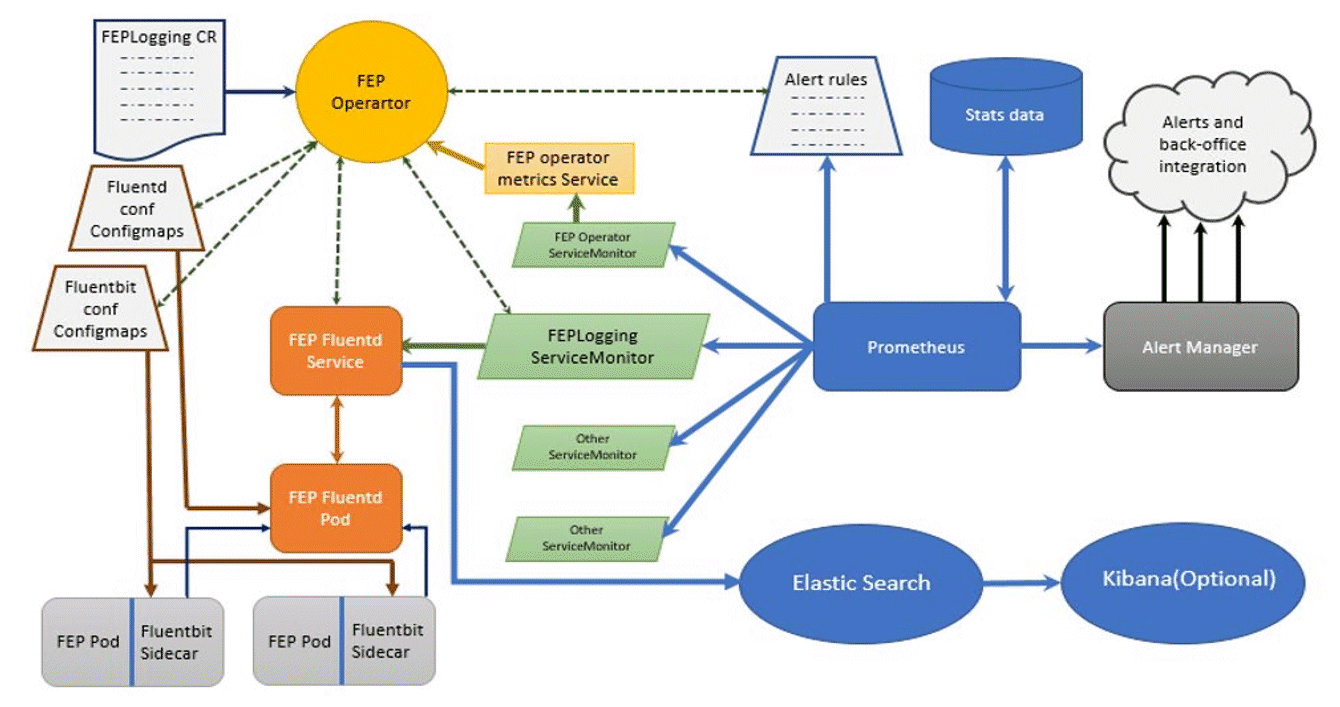
Fluentbit is deployed as a sidecar in the FEPCluster along with patroni and collects postgres database logs. Fluentd is installed with the fluent-plugin-prometheus plugin required for integration with Prometheus and fluent-plugin-elasticsearch plugin required for integration with Elasticsearch.
Fluentd counts the occurrence of different severity levels (PANIC, FATAL, ERROR, WARNING, DEBUG etc) by filtering the incoming log records and the counts are passed onto Prometheus along with the logfile name. The log file name makes it easier to investigate the reason of severity/issue.
If elastic search is enabled and configured, then fluentd sends logs to elastic search which can be viewed in kibana.
