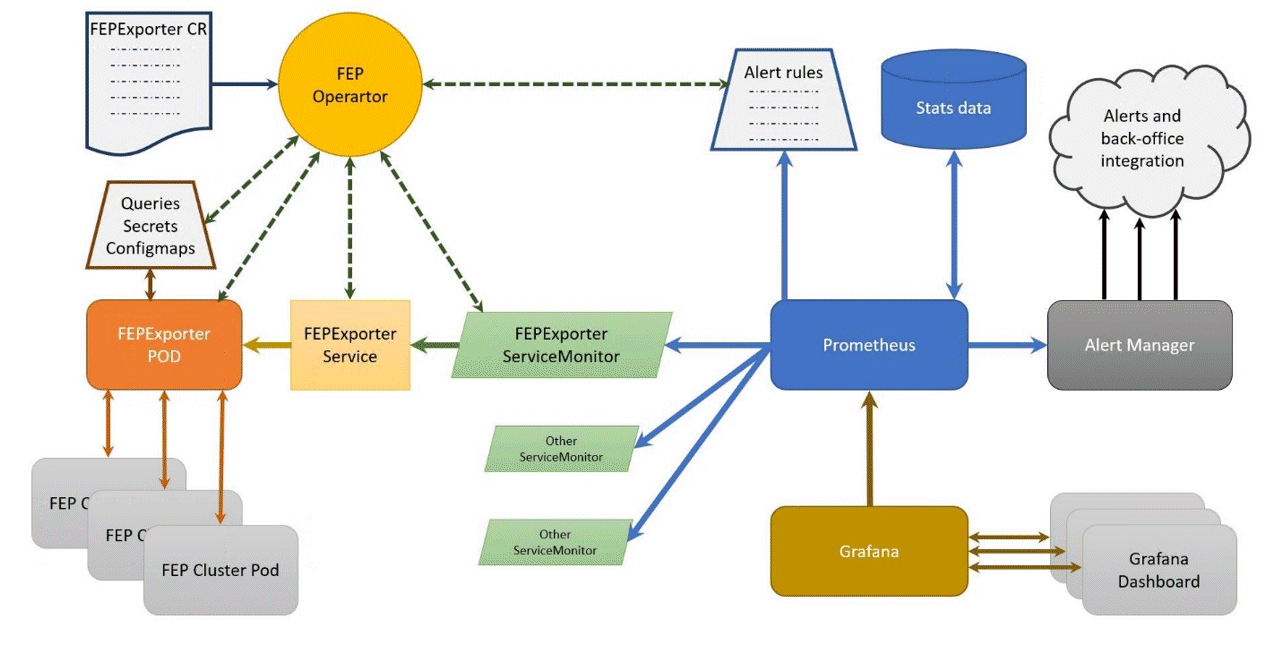
Monitoring and alerts system leverages standard GAP stack ( Grafana, Alert manager, Prometheus) deployed on OCP(OpenShift Container Platform) and Kubernetes. GAP stack must be there before FEP operator & FEPCluster can be deployed.
Prometheus is a condensed way to store time-series metrics. Grafana provides a flexible and visually pleasing interface to view graphs and guages of FEP metrics stored in Prometheus.
Together they let store large amounts of metrics that user can slice and break down to see how the FEP database is behaving. They also have a strong community around them to help deal with any usage and setup issues.
The Prometheus acts as storage and a polling consumer for the time-series data of FEP container. Grafana queries Prometheus to displaying informative and very pretty graphs.
If Prometheus rules are defined, it also evaluates rules periodically to fire alerts to Alert manager if conditions are met. Further Alert manager can be integrated with external systems like email, slack, SMS or back-office to take action on alerts raised.
Metrics from FEP Cluster(s) is collected by Prometheus through optional components deployed using FEP Exporter with default set of metrices and corresponding Prometheus rules to raise alerts. User may extend or overwrite metrics by defining their custom metrics queries and define their custom Prometheus rules for alerting.
